Skip to content
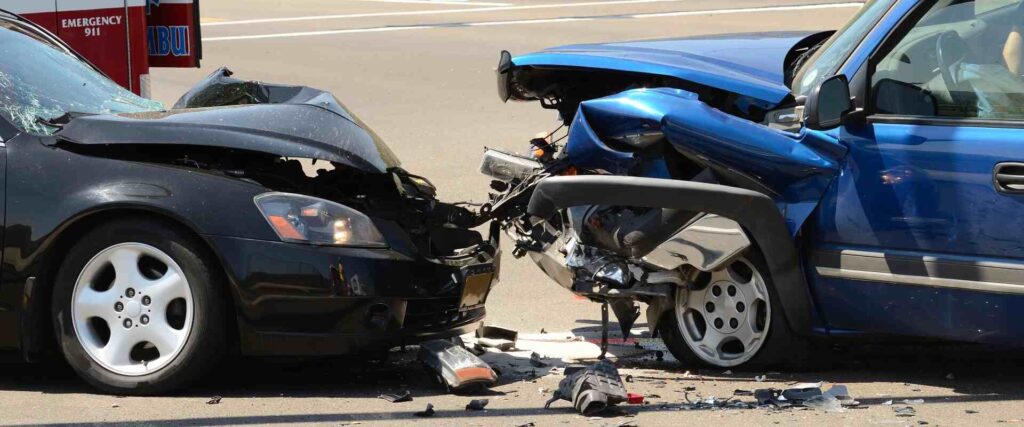
Driving involves many factors that affect safety. One key question for new and experienced drivers is at what speeds do moderate risks usually occur. This topic matters because understanding risk levels helps people drive safer. In this post, we will look at what moderate risks mean in driving. We will cover speed ranges where these risks show up most often. We will also share facts from safety studies and tips to lower risks. The goal is to give clear, useful info based on real data.
Moderate risks in driving are not the lowest or highest dangers. They sit in the middle. Low risks happen in quiet spots like empty parking lots. High risks appear on busy highways with fast traffic. Moderate risks often come up in everyday settings like city streets or suburbs. Knowing at what speeds do moderate risks usually occur can help drivers adjust their habits.
What Does Moderate Risk Mean in Driving?
First, let’s define risk in driving. Risk means the chance of a crash or injury. It depends on speed, road type, traffic, and driver actions. Safety groups like the National Highway Traffic Safety Administration (NHTSA) study this. They group risks into low, moderate, and high.
Low risk: Slow speeds, few cars, good visibility. Think of driving in a neighborhood at 20 mph.
Moderate risk: Some traffic, intersections, pedestrians. Crashes can happen but are not always severe.
High risk: Fast speeds, heavy traffic, poor conditions. Like rushing on a highway at 70 mph plus.
Moderate risks balance control and danger. Drivers have time to react, but mistakes can lead to problems. Data shows moderate risks link to common accidents like rear-ends or side swipes.
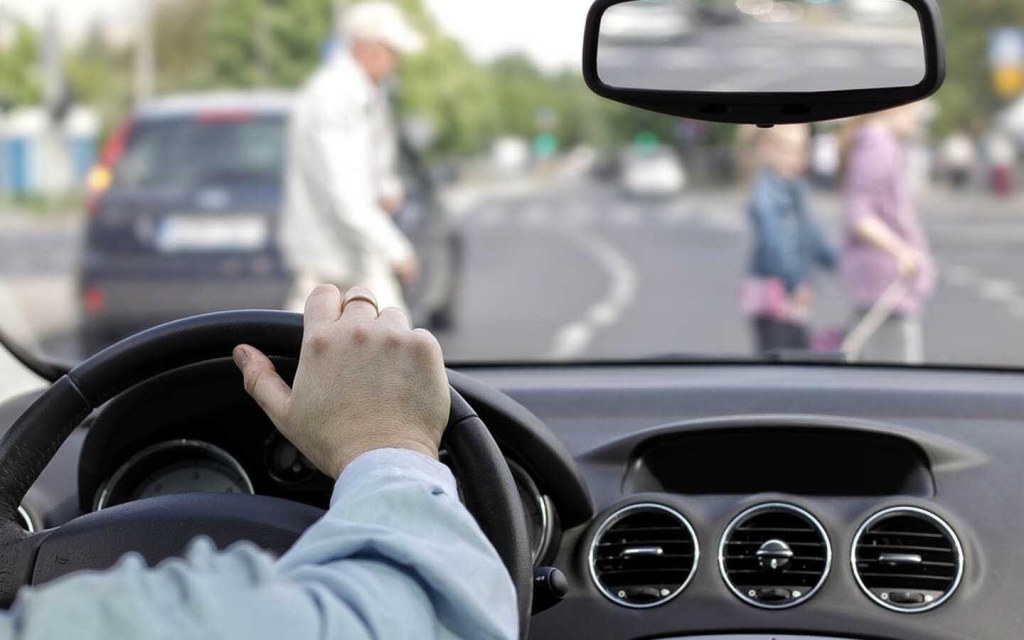
From driver’s ed courses, moderate risks tie to speeds where drivers feel safe but face surprises. For example, a child running into the street or a car turning suddenly.
Key Speed Ranges for Moderate Risks
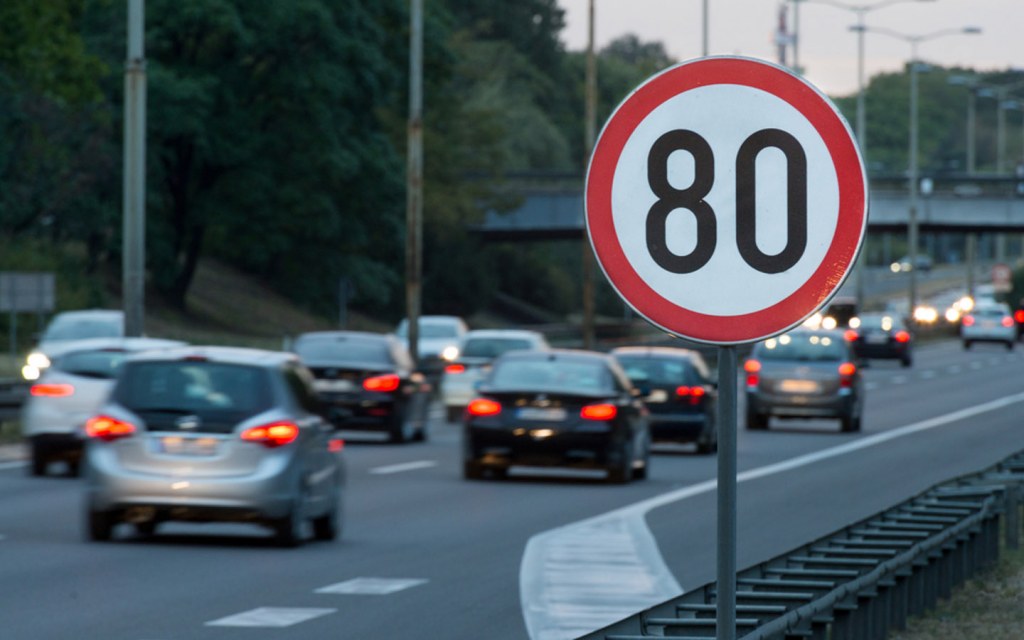
Now, to the main question: at what speeds do moderate risks usually occur? Sources point to speeds under 50 mph as the common range. This comes from quizzes, safety tests, and studies.
In many driver’s education programs, like those from Aceable, moderate risks occur under 50 mph. This speed allows for reaction but increases impact force compared to slower speeds.
Some reports say under 60 mph. But most agree on under 50 mph for moderate levels. Why? At these speeds, stopping distance grows. A car at 40 mph needs more space to stop than at 20 mph.
Let’s break it down by numbers:
- Under 30 mph: Often low risk in controlled areas.
- 30-50 mph: Moderate risk zone. Common in suburbs and cities.
- Over 50 mph: Risks rise to high, especially on open roads.
One study from the Insurance Institute for Highway Safety (IIHS) notes that at 40 mph, crash tests show good safety ratings for vehicles. But real-world factors like pedestrians change this.
In urban areas, speed limits are 25-45 mph. Here, moderate risks include hitting curbs or minor collisions. On rural roads, 40-50 mph brings risks from curves or animals.
Data from the World Health Organization (WHO) shows every 1% speed increase raises fatal crash risk by 4%. For moderate injuries, the curve starts around 30-40 mph.
How Speed Affects Crash Risk
Speed plays a big role in crashes. Higher speed means less time to react. It also boosts impact energy. Physics tells us kinetic energy squares with speed. Double the speed, quadruple the force.
At moderate speeds, risks are real but manageable. For example, at 40 mph, pedestrian fatality risk is about 46%. At 30 mph, it’s 20%. This shows the shift from low to moderate.
NHTSA data links speeding to 30% of fatal crashes. But for moderate risks, it’s about non-fatal incidents. These include fender benders or injuries needing hospital care but not life-threatening.
In one report, risks of moderate injury climb at 35 mph for pedestrians. For drivers, seatbelts and airbags help, but speed still matters.
Table: Risk Levels by Speed (Based on Average Data)
| Speed Range | Risk Level | Common Scenarios | Fatality Risk Example (Pedestrian) |
|---|---|---|---|
| Under 20 mph | Low | Parking lots, driveways | Less than 5% |
| 20-40 mph | Moderate | City streets, suburbs | 10-40% |
| 40-60 mph | Moderate to High | Rural roads, light highways | 40-70% |
| Over 60 mph | High | Busy highways | Over 70% |
This table uses info from IIHS and WHO. It shows at what speeds do moderate risks usually occur: mostly 20-50 mph.
Factors That Influence Moderate Risks at These Speeds
Speed alone does not set risk. Other things play in. Road type is one. In cities, 30-40 mph brings moderate risks from stops and turns. On highways, the same speed might be low risk if traffic flows smooth.
Weather affects it. Rain or fog makes 40 mph riskier. Visibility drops, stopping takes longer.
Driver age matters. Teens face higher risks at moderate speeds due to lack of experience. Older drivers might struggle with reaction time.
Vehicle type counts. Trucks at 40 mph have higher risks due to weight. Cars with good brakes handle better.
Traffic volume: Light traffic at 45 mph is moderate. Heavy traffic pushes it higher.
Distractions like phones increase risks at any speed, but at moderate levels, they cause more crashes because drivers think it’s safe.
Location: Suburban areas with 40-50 mph limits see moderate risks from kids, bikes, and pets.
Moderate Risks in Different Driving Environments
Let’s look at settings where moderate risks occur.
Urban Areas
Cities have speed limits of 25-40 mph. Moderate risks come from traffic lights, crosswalks, and parked cars. At 35 mph, a sudden stop can lead to a crash. Pedestrian risks rise here.
Example: Driving through a downtown at 30 mph. A bike swerves out. Reaction time is short, but possible.
Suburban Neighborhoods
Speeds 30-45 mph. Risks from driveways, schools, and curves. Moderate because visibility is good, but surprises happen.
Case: A driver at 40 mph hits a pothole. Loss of control leads to a minor accident.
Rural Roads
40-55 mph common. Moderate risks from narrow lanes, hills, and wildlife. Less traffic, but higher speeds within moderate range increase impact.
Stat: Rural crashes often at 45-50 mph due to curves.
Highways with Moderate Traffic
50-60 mph. Here, moderate risks shift to high if traffic builds. Merging lanes add danger.
Night driving: Risks higher at moderate speeds due to low light.
Statistics on Crashes at Moderate Speeds
Data backs this up. IIHS says high speeds make crashes worse, but many happen at moderate levels.
In 2021, speeding caused 12,000 deaths in the US. Many at 40-50 mph.
European studies show accident risk powers up with speed. At 50 km/h (about 31 mph), risk doubles from 30 km/h.
For teens, crash rates are 8-21 per 10,000 km in moderate risk groups.
Pedestrian data: At 32 mph, severe injury risk is 25%. At 42 mph, 50%.
Truck crashes: 76% involve other vehicles at speeds where moderate risks occur.
These numbers show moderate risks build around 30-50 mph.
Comparing Moderate Risks to Low and High Risks
Low risks: Under 20 mph. Crashes rare, injuries minor. Like school zones.
Moderate: 20-50 mph. Crashes more common, injuries possible but often treatable.
High: Over 60 mph. Fatalities jump. Stopping distance doubles from 40 to 80 mph.
Example: At 20 mph, a bump might dent a car. At 40 mph, it could total it. At 70 mph, lives at stake.
Safety tech helps at moderate speeds. Airbags deploy best at 8-14 mph impacts, but speed affects overall.
How to Lower Risks at Moderate Speeds
Knowing at what speeds do moderate risks usually occur is step one. Step two is action.
- Follow speed limits. They set for conditions.
- Keep distance. Use three-second rule.
- Scan ahead. Look for hazards.
- Avoid distractions. No phones.
- Adjust for weather. Slow down in rain.
- Use lights at night.
- Wear seatbelts. Always.
For teens: Practice in moderate areas first.
For trucks: Maintain equipment, avoid fatigue.
Cities can help with better signs, lower limits in risky spots.
Real-Life Examples and Case Studies
Case 1: A driver at 45 mph in suburbs hits a deer. Moderate risk leads to vehicle damage, no injury.
Case 2: Urban at 35 mph, rear-end due to stop light. Injuries minor, but costly.
From NHTSA: Many crashes in Texas from speeding under 50 mph.
IIHS test: Cars at 40 mph frontal crash show survivable with good ratings.
Global: In villages, 50 km/h limits cut risks.
These stories show moderate risks are common but preventable.
Legal Side of Speed and Risks
Laws set speed limits to match risk. Breaking them leads to tickets. In crashes, speeding proves fault.
In the US, states vary limits. Cities often 30-40 mph for moderate areas.
If a crash at moderate speed shows negligence, insurance rises.
Safe speed is not always the limit. Conditions matter.
Impact on Different Road Users
Pedestrians: Most vulnerable. At 30-40 mph, risks moderate to high.
Cyclists: Similar to peds. Helmets help, but speed impacts.
Motorcyclists: Higher injury at moderate speeds due to no enclosure.
Other drivers: Rear-ends common at 40 mph.
Kids: School zones lower to 20 mph to cut moderate risks.
Future Trends in Speed Safety
Tech like auto braking reduces risks at moderate speeds.
Speed cameras enforce limits.
Electric cars stop faster, might lower impacts.
Studies continue. ITF reports speed-crash links.
Cities test 20 mph zones to shift moderate risks down.
For more information visit Traffic signs test.
Wrapping Up
To answer at what speeds do moderate risks usually occur: mostly under 50 mph, in everyday driving. This range covers city, suburb, and rural spots where traffic mixes with hazards. Data from NHTSA, IIHS, and WHO supports this. By staying alert, following rules, and adjusting for conditions, drivers can cut these risks. Safe driving saves lives and money. Remember, speed choice affects everyone on the road.